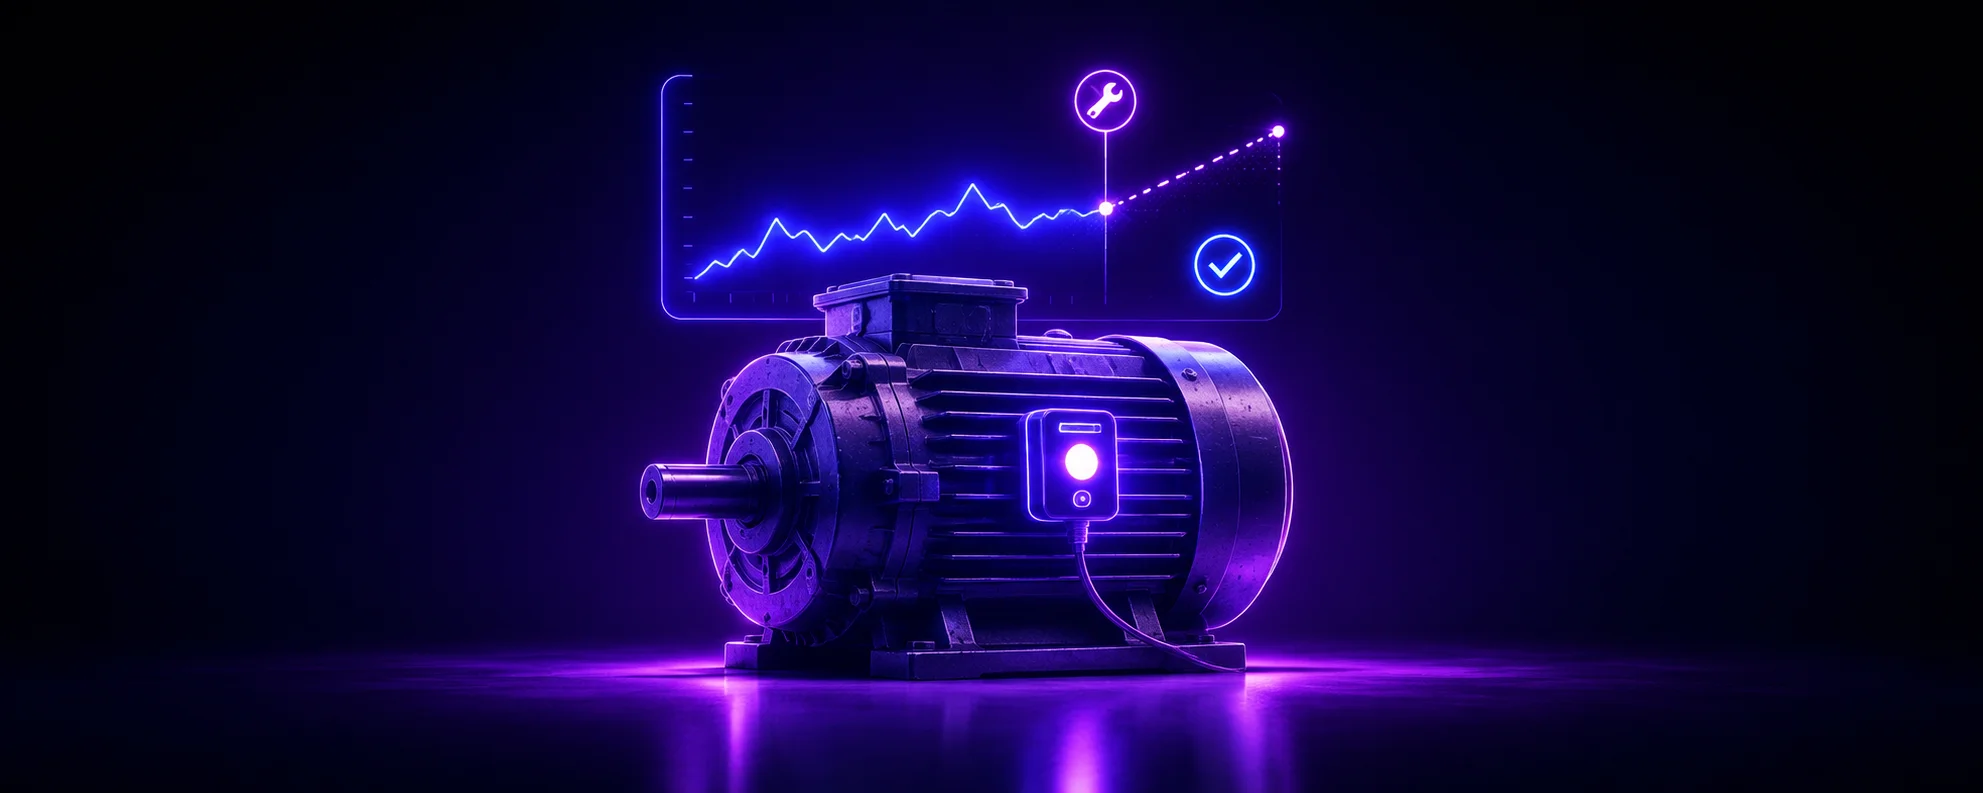
Predictive maintenance does not require a modern factory; it can work with decades-old equipment and minimal digital infrastructure. Most plants are not starting with a clean-sheet automation project. They are starting with equipment that still makes good product, maintenance routines people trust, and just enough digital history to know where the pain is. And in many cases, you can get there with signals the plant already has, then add a lightweight retrofit only where data is actually missing.
What matters more for the first asset is whether a single important failure signals early enough to change the maintenance decision.
Start With the Signal You Already Have
Older equipment often gives you more to work with than it appears. Start with the signals already coming from the machine and the maintenance history around it. Add sensing only where a missing signal keeps the team from seeing a failure early enough to act.
Old Machines Already Produce Useful Signals
It is easy to assume that an old machine has nothing useful to tell you because it was never designed with predictive maintenance in mind. But maintenance teams have been reading those machines for years — through cycle time, current draw, sound, heat, operator comments, and the way the machine behaves under load.
You do not need a nine-figure downtime problem for that logic to matter. If one bearing failure takes the constrained line down for half a shift, that is already enough to justify asking what signal showed up first. While a large plant can lose nine figures in unplanned downtime—with losses reaching the trillion-dollar scale across the industrial Global 500 according to Senseye’s studies—the core value is local: it is about keeping the line running.
The real challenge is choosing the first asset and the failure mode to monitor.
Path 1. Your Data Baseline
Where should PdM start?
Start with the machines that hurt the operation most when they go down. Ask the crew which ones make everybody nervous when the line is busy, then check whether the history backs that up.
Keep the first pilot deliberately narrow: one asset, one failure mode, roughly ninety days of measured operation. I wouldn’t move to the second asset until the first scorecard tells you something useful.
The history helps you narrow that down further, because it shows which failure modes are actually costing the operation the most.
Once you know which assets matter, take stock of the data you already have around them.
Use the Data the Plant Already Has
Before buying anything, sit down with maintenance, controls, MES, and data owners to take stock of existing PLC tags, alarm history, cycle counts, work orders, and operator notes. Edge gateways or MES integrations can bring these signals together without changing the machine itself, putting them directly where the maintenance team can use them.
PdM starts to make sense when two things line up: the asset matters, and you have a signal worth trusting.
That exercise also shows you where the signal is missing and where the process knowledge still lives mostly with the operators.
Path 2. Non-Invasive Sensing AI-PdM
Use Vision and Sound for Non-Contact Monitoring
Computer vision and acoustics add a non-contact signal layer without modifying the machine. Sometimes the retrofit is really that simple: one fixed camera watching a belt or shaft, or one microphone mounted near the housing. You do not need to turn the machine into a science project. You can keep processing at the edge, retain clips only when something abnormal occurs, and, in many cases, keep the first pilot off the control network altogether.
Build Health Signals From Existing Machine Data
‘Virtual sensor’ sounds more sophisticated than it usually is. In practice, it can simply be a software-derived health signal built from controller states the machine already exposes. Combine that with acoustic, thermal, or vision data, and an old asset can get useful diagnostic coverage without a major retrofit.
Usually the system grows pretty naturally from there: vision and acoustics give you quick coverage, the history helps refine asset criticality, and then you add instrumentation only where it clearly improves the signal.
Only a few assets will justify going beyond pure observation. That’s where lightweight retrofits earn their place.
Path 3. Lightweight Retrofit
So when does a physical retrofit actually make sense? Usually when the extra signal can prevent more downtime than the sensor costs to deploy and maintain.
Legacy equipment usually exposes a familiar set of signal-quality problems:
- Unreliable tags: PLC or controller values that update irregularly or fail to reflect true operating states.
- Inconsistent operator inputs: manual entries, checklists, or downtime codes that vary from shift to shift.
- Sparse maintenance logs: incomplete records that make it hard to trace recurring failure modes or past interventions.
- Weak external signals: vibration, heat, or sound data that is too coarse to show the failure clearly.
I’ll add a physical sensor only after the first data pass shows what is missing. If current draw already gives you the lead time you need, there is no reason to mount vibration everywhere just because the technology is available.
Once the system sees a meaningful change, the next problem is turning that signal into something a technician can act on.
The sensing layer can tell you that something is changing, but the technician still has to decide what to inspect next. That’s where a maintenance copilot can help, as long as it stays grounded in the current work order, the prior repair history, and the relevant manual section. Preserve that document context during ingestion. A torque table without its heading may still be searchable, but it can be operationally dangerous. The technician does not need another confident paragraph from AI; they need to know why this recommendation applies to this asset, on this work order, right now.
And if the missing piece really is physical signal, that’s where the lightweight retrofit comes in. Lightweight retrofit sensors earn their keep by adding useful signal without opening or modifying the machine. The goal is simple: buy the one missing signal that changes the maintenance decision. Depending on the failure mode, that might be:
- CT current clamps: useful for motor-load imbalance, rising friction, rotor stress, or phase asymmetry.
- Surface-mounted accelerometers: detect early signs of mechanical looseness on gearboxes, motors, or housings.
- Magnetic thermal probes: reveal thermal drift linked to lubrication breakdown or mounting strain.
- Non-contact IR thermal sensors: spot hotspots in electrical panels, busbars, or tight access areas.
- Clip-on vibration pucks: ideal for rotating assets needing continuous vibration monitoring.
In general, I would keep latency-sensitive or restricted plant data at the edge and use the cloud for the broader historical analysis across assets or plants.
Even after the gateways and retrofits go in, the data still needs some housekeeping. Next, get that messy stream into shape before the model starts trusting it.
Path 4. Make the Stream Trustworthy
Legacy data will be messy. That’s pretty normal.
A PLC tag can freeze for half a shift. An operator enters the same downtime reason three different ways. A sensor gets replaced and suddenly reports on a slightly different scale. None of that means the plant is not ready for predictive maintenance. It just means the model needs a clear rule for what it is allowed to trust.
Before training anything important on that stream, I would draw a hard line between signals we trust enough to make a maintenance call and everything else.
For every tag the model is allowed to use, I would want a few basic things written down:
- Source. Which PLC, controller, gateway, sensor, or calculated value produced it?
- Freshness. How stale can a reading get before you stop treating it as current?
- Expected range. What values are physically reasonable for this asset?
- Update behavior. Should this signal change every second, every cycle, or only when the machine changes state?
- Failure behavior. What happens when the tag freezes, disappears, or starts reporting something impossible?
- Owner. Who decides whether the signal is trustworthy enough to put back into service?
- Decision dependency. Which PdM alert or maintenance action depends on that signal?
A bad temperature tag should never become a bad maintenance recommendation.
I would resist the urge to clean up the entire historian before the pilot starts. That’s an easy way to turn a maintenance project into a year-long data program. Clean the small set of signals tied to the failure mode you are actually trying to catch. The rest can stay where it is until there is a reason to use it.
The same thing applies to operator-entered data. If one shift logs a stop as “bearing,” another logs it as “mechanical,” and a third logs it as free text, the model does not really have three useful labels. It has one event with three different labels. Give the crew a short, shared list of the failure modes that matter to the pilot, and leave the long tail alone for now.
You also want to catch signal drift before the model does, because a sensor replacement, controller change, or new operating mode can move the baseline even when nothing is wrong with the machine. If the model sees that change first, it may call a failure that was never there.
- Is the tag still updating?
- Has its normal range moved?
- Did a sensor or controller configuration change?
- Did the product, recipe, or operating mode change with it?
- Is the same condition visible in another signal?
You do not need a sophisticated data-quality platform to answer those questions on the first asset. You just need enough evidence to know whether the machine changed or the data changed.
If the system is going to send someone across the plant to open a machine, it should be able to explain what changed and which signal triggered the alert.
Once the stream is trustworthy enough, the model finally has something solid to work with.
Path 5. Metrics
PdM earns its case on the plant floor: more lead time, fewer emergency stops, less firefighting.
Once that stream is trustworthy enough, the next question is whether the pilot is actually improving maintenance.
Make Sure the Alert Reaches the Technician
With older gear, selective edge processing is usually the practical approach. Bandwidth and infrastructure constraints make full-stream processing impractical.
The edge layer should turn raw telemetry into an event the crew can actually use before it reaches the HMI, CMMS, or MES. At minimum, the event should tell the crew which asset is involved, what job or product was running, how severe the condition is, and which work order it belongs to.
Track the share of qualified PdM events that arrive in the technician’s normal workflow with the asset, severity, operating context, and work-order link intact.
From there, publish the alert into the system the crew already works in, whether that’s an HMI alarm list, a CMMS work order, or an MES view. The point is to make the alert show up where the work already happens.
Measure the Full Path From Alert to Action
Before the pilot starts, put one person on the hook for the scorecard and agree on a short list of PdM metrics.
For a legacy asset, a sensible PdM scorecard usually includes:
- Anomaly lead time. Measure the time between detection and the point when the failure would have affected production.
- Mean intervention time. Measure the time from alert to maintenance action.
- Repeat failure frequency. Track how often the same failure mode recurs on the same asset within a defined window.
- Energy or load drift. Track deviation in energy use, current draw, or motor load from the asset’s established baseline.
- Recovery duration. Measure the time from intervention to stable production.
- False alert rate. Track how many alerts do not lead to a verified condition or useful intervention.
For a 90-day pilot, keep the scorecard tight. Three to five metrics you can review every week are plenty. You have a case for the next rollout if those numbers move on one asset.
Separate model performance from system performance. A model can detect the correct failure pattern, yet the PdM system may still miss the maintenance window because the operational pipeline has failed. Measure both sides: whether the model recognized the condition, and how long the complete path from signal to actionable work order actually took. A good model only gets you partway.
Also, a single false alert can hide what actually went wrong. In a multi-stage system, each link is a potential point of failure. Keep enough trace data to find the failure point whenever an alert is wrong: Was the source signal bad? Did the edge transformation distort it? Did the model classify a normal condition as an anomaly? Was the alert mapped to the wrong failure mode? Or was the prediction correct but the work-order integration failed? If all five get dumped into the “false alert” bucket, you have no idea which part of the system needs fixing.
Use Technician Findings as Ground Truth
Capture the technician’s actual disposition, because it tells you far more than a thumbs-up or thumbs-down. They opened the machine and saw the physical condition. That is the ground truth the model was missing. That observation is worth more than another confidence score from the model. Over time, those dispositions become the yardstick for whether the next model is actually better than the one already running.
Tie the Pilot to Plant-Level Results
PdM has to show up in the plant metrics already used to run the operation.
- Unplanned downtime hours on the pilot asset or line
- Throughput and schedule adherence for the line that the asset is on
- Scrap and rework rate tied to the asset’s problem areas
- Emergency vs planned maintenance ratio
- Overtime and call-out hours for maintenance on that equipment.
One thing does have to line up: the PdM event needs to carry the same asset, work-order, and line identifiers the plant already uses in MES and ERP. A useful monthly review might sound like: “On Line 2, the mixer PdM pilot caught seven issues before they caused failures. The result: 14 hours of avoided downtime, 10,000 fewer scrap units, and three fewer emergency call-outs than in the previous quarter.”
Those are the numbers plant managers and CFOs remember.
Put Recommendations Inside the Work Order
A maintenance copilot should meet the technician inside the work order they already use. Put the recommendation there, tie it to the current condition and prior repair, and let the technician act without opening another tool.
Metric 6: Fleet-Wide PdM ROI
By Plant #2, this should feel like a rollout instead of another science project. Use the same metrics, connect into the same edge data flow, map the alerts into the same MES or ERP workflow, and review the same scorecard every month.
Case Snapshots: Legacy Equipment, Real Results
These examples show how far PdM can go with a surprisingly small sensor footprint, drawing from production visibility, fleet-scale analysis, and structured maintenance history.
Siemens Senseye publishes fleet scale above 10,000 assets, and clients report up to a 50% reduction in unplanned downtime on monitored machines. That is a platform result after telemetry is in place, not a camera-only pilot.
For a European bus transport company, we turned their maintenance history and spare parts records into a single, centralized database. That gave the team a continuous event stream they could finally put to work in predictive planning. Our case study documents the full implementation in our case study.
Sum Up
Across published industrial programs, PdM deployments consistently report 30–50% lower unplanned downtime, OEE gains in the single-digit to low-double-digit range, and useful warning windows for selected failure modes.
The first pilot does not have to prove the whole PdM strategy. It has to prove that a single failure can be detected early enough for the crew to take action.
Devox Software keeps the playbook deliberately simple: one asset, one failure mode, one scorecard. Prove it there, route the alert into the CMMS or MES the crew already uses, then carry the same playbook to the next line.
Frequently Asked Questions
-
Which PdM tools and vendors work without sensors?
Out in the market, it’s a common challenge to figure out which IT consulting service is best for developing tools that help older equipment open up.
Several modern Predictive Maintenance (PdM) platforms can be made to work just fine with legacy equipment, requiring little or no extra sensors at all. Where there are gaps, an outside partner can build some basic edge and AI tools around the signals that are already coming out of your machines.
Optical and thermal methods, in general, do a great job of spotting mechanical and electrical drift before an operator would ever even notice it by feel or sound. Then there’s the acoustic and telemetry side of things. Augury, for instance, is able to tune in to the sound of your machines and learn what is normal and what is not. Meanwhile, MachineMetrics is just reading the current flow and all the legacy PLC signals. Uptake and C3.ai are taking a step back to monitor the entire fleet of machines across big operations. Fiix is integrating software predictive maintenance alerts directly into daily maintenance operations, ensuring insights are delivered where teams already manage work orders.
But these are just a few examples from a much bigger PdM ecosystem. At Devox Software, we usually start by mapping out all the signals that your legacy equipment is already putting out. We’d then recommend and integrate a mix of off-the-shelf platforms and some custom edge tooling — just to get you up and running with some practical PdM inside your normal OT and maintenance workflows.
-
Which edge devices and protocols support PdM on legacy equipment?
When all these signals reach the gateway, the device near the machine takes over. Older lines handle only small data flows, so the gateway trims the chaos right at the edge. The gateway distills raw machine behavior into clean features that the AI can score instantly.
That’s why gear from Advantech, Beckhoff, or Jetson-style modules works so well. They score the patterns in real time, quiet the junk, and send only the parts that matter forward. Thanks to that, the plant network stays steady, bandwidth stays free, and the system reacts within milliseconds — even when the connection dips or wobbles.
Moreover, modern gateways make it possible to bridge these controllers into today’s data workflows without touching a single line of logic. Bosch Rexroth’s CtrlX with Device Bridge and other industrial gateways will pull values from Modbus, Profibus, or Siemens S7 and convert them into standardized MQTT or OPC UA events.
Legacy PLCs somehow manage to add a third channel — even the compact ones are pulling their weight by providing current signatures, temperature readings, timing sequences, and some pretty important transition logic. And then there are gateways like Bosch Rexroth’s CtrlX or Advantech-class industrial edge devices — they simply pull these values from Modbus, Profibus, or Siemens S7 without forcing you to re-write the control logic from scratch. Once they’ve got all that data, they let AI build a pretty detailed behavioral fingerprint of each machine. When you combine that with visual and acoustic streams, you end up with accuracy levels comparable to those of an early-stage, sensor-based PdM deployment.
-
What are the OT security requirements for PDM?
For legacy plants, maintaining OT-aligned security is paramount, which is why, like Purdue-aligned segmentation. They’re putting in virtualised control servers and hardening up their gateways. All this helps raise the quality of the data you’re getting and gives you safe channels to send your PdM signals along. Now, the fact that we’re seeing all these upgrades happening is a pretty big deal — it’s one of the main drivers for doing this kind of work.
Privacy and audit trails fall into place once PdM flows through the same systems that already carry compliance rules. ERP and MES handle retention, traceability, and data lineage every day, so a PdM alert that enters that stream gains the same protection as quality checks or batch records. It even helps compliance by catching drift early and making hidden workarounds visible.
-
Do I need a digital twin when I have limited data?
Digital twins can create a level of diversity that real-world data with gaps just can’t give you. You end up with a bunch of bits and bobs like, for example, the logic of the old PLCs, how the machine behaves under different loads, how heat disperses, and the tiny little movements it makes, all put together into controlled scenarios that show what makes the machine tick — the physics of the old kit. All this simulation creates a better understanding of what normal and broken behavior looks like, and that, in turn, gives any anomaly detectors a lot more to go on, even before the plant has built up a big historical record.
As you gather more real-life data, the twin keeps on learning, making sure the simulated stuff it’s come up with matches what’s really happening in the real world. That’s a feedback loop that just keeps getting better at predicting.